Sales Revenue
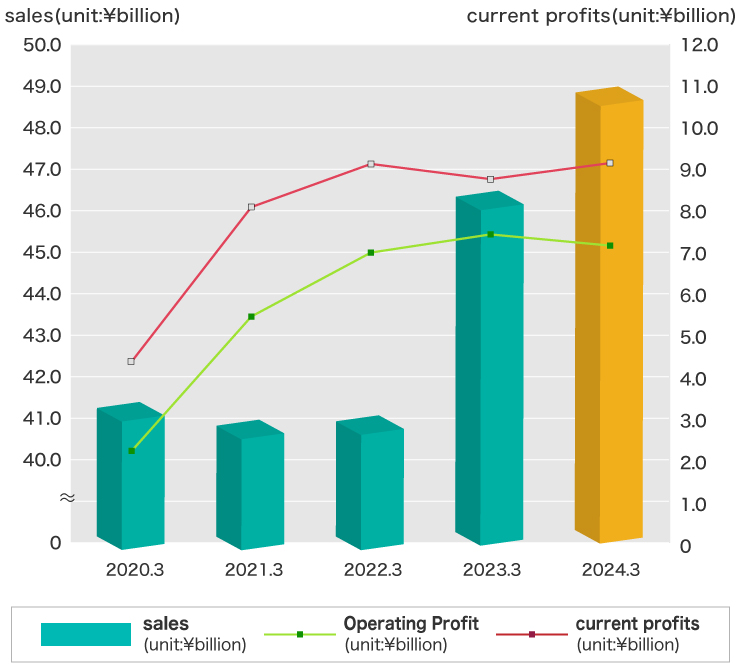
| 2021.3 | 2022.3* | 2023.3* | 2024.3* | 2025.3* | |
|---|---|---|---|---|---|
| Sales Revenue | 40.7 | 40.8 | 46.4 | 48.9 | 48.9 |
| Operating Profit | 5.4 | 6.9 | 7.4 | 7.1 | 2.4 |
| Ordinary Profit | 8.0 | 9.1 | 8.7 | 9.1 | 2.9 |
| Total Assets | 75.8 | 83.9 | 88.2 | 98.4 | 100.2 |
*A new accounting standard for revenue recognition has been applied since FY (financial year) 2021.
Unit: Billion yen
Sales Breakdown
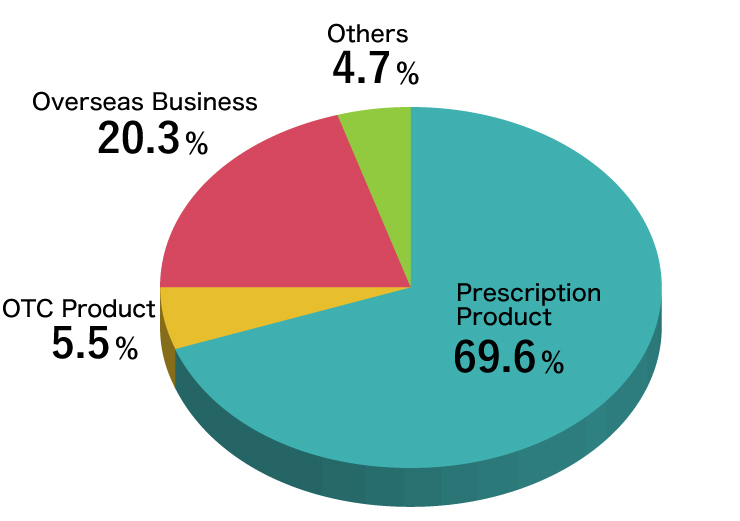
| 2021.3 | 2022.3* | 2023.3* | 2024.3* | 2025.3* | ||||||
|---|---|---|---|---|---|---|---|---|---|---|
| Sales | Per | Sales | Per | Sales | Per | Sales | Per | Sales | Per | |
| Prescription Product | 32.5 | 79.8% | 30.1 | 73.6% | 34.0 | 73.4% | 34.0 | 69.6% | 33.7 | 68.9% |
| OTC Product | 2.5 | 6.3% | 2.2 | 5.6% | 2.2 | 4.7% | 2.6 | 5.5% | 2.8 | 5.7% |
| Overseas Business | 5.1 | 12.5% | 6.4 | 15.8% | 8.1 | 17.5% | 9.9 | 20.3% | 10.9 | 22.4% |
| Others | 0.5 | 1.2% | 2.0 | 5.0% | 2.0 | 4.4% | 2.2 | 4.7% | 1.4 | 2.9% |
*A new accounting standard for revenue recognition has been applied since FY (financial year) 2021.
Unit: Billion yen